Overview
City transport has long run on partial information, driver reports, passenger complaints, and periodic surveys that only reveal a problem after it has already caused delays or put someone at risk. AAI Labs built a system that replaces this guesswork with continuous, real-time intelligence: combining 5G with AI to watch traffic, passengers, road conditions, and vehicle health around the clock.
Built together with JUDU, the Vilnius City Municipality Administration, and a group of local operational and engineering partners, the project has finished a fully operational pilot across central Vilnius corridor: 15 connected devices spanning 5 buses, 5 signaled intersections, and 5 bus stops, real world deployments with real world use.
The Challenges
Four problems shaped everything this project set out to build.
Lacks measurement of traffic flow and passenger congestion: no ongoing, reliable way to know how busy a lane or intersection was, or how congested a bus stop was at a given moment, which meant no evidence-based way to identify which routes and stops actually needed attention.
Traffic violations and accidents that put people at risk: this includes vehicles blocking intersections or misusing bus lanes that could easily go unnoticed without anyone watching continuously.
Road conditions were handled reactively: potholes, damaged manhole covers, and other hazards surfaced only when a citizen noticed one and reported it to the municipality, a slow and inconsistent path from problem to repair.
Unpredictable Bus Breakdowns: because nothing was monitoring vehicle health in real time, mechanical issues typically surfaced only once something had already gone wrong on the road.
The Solution
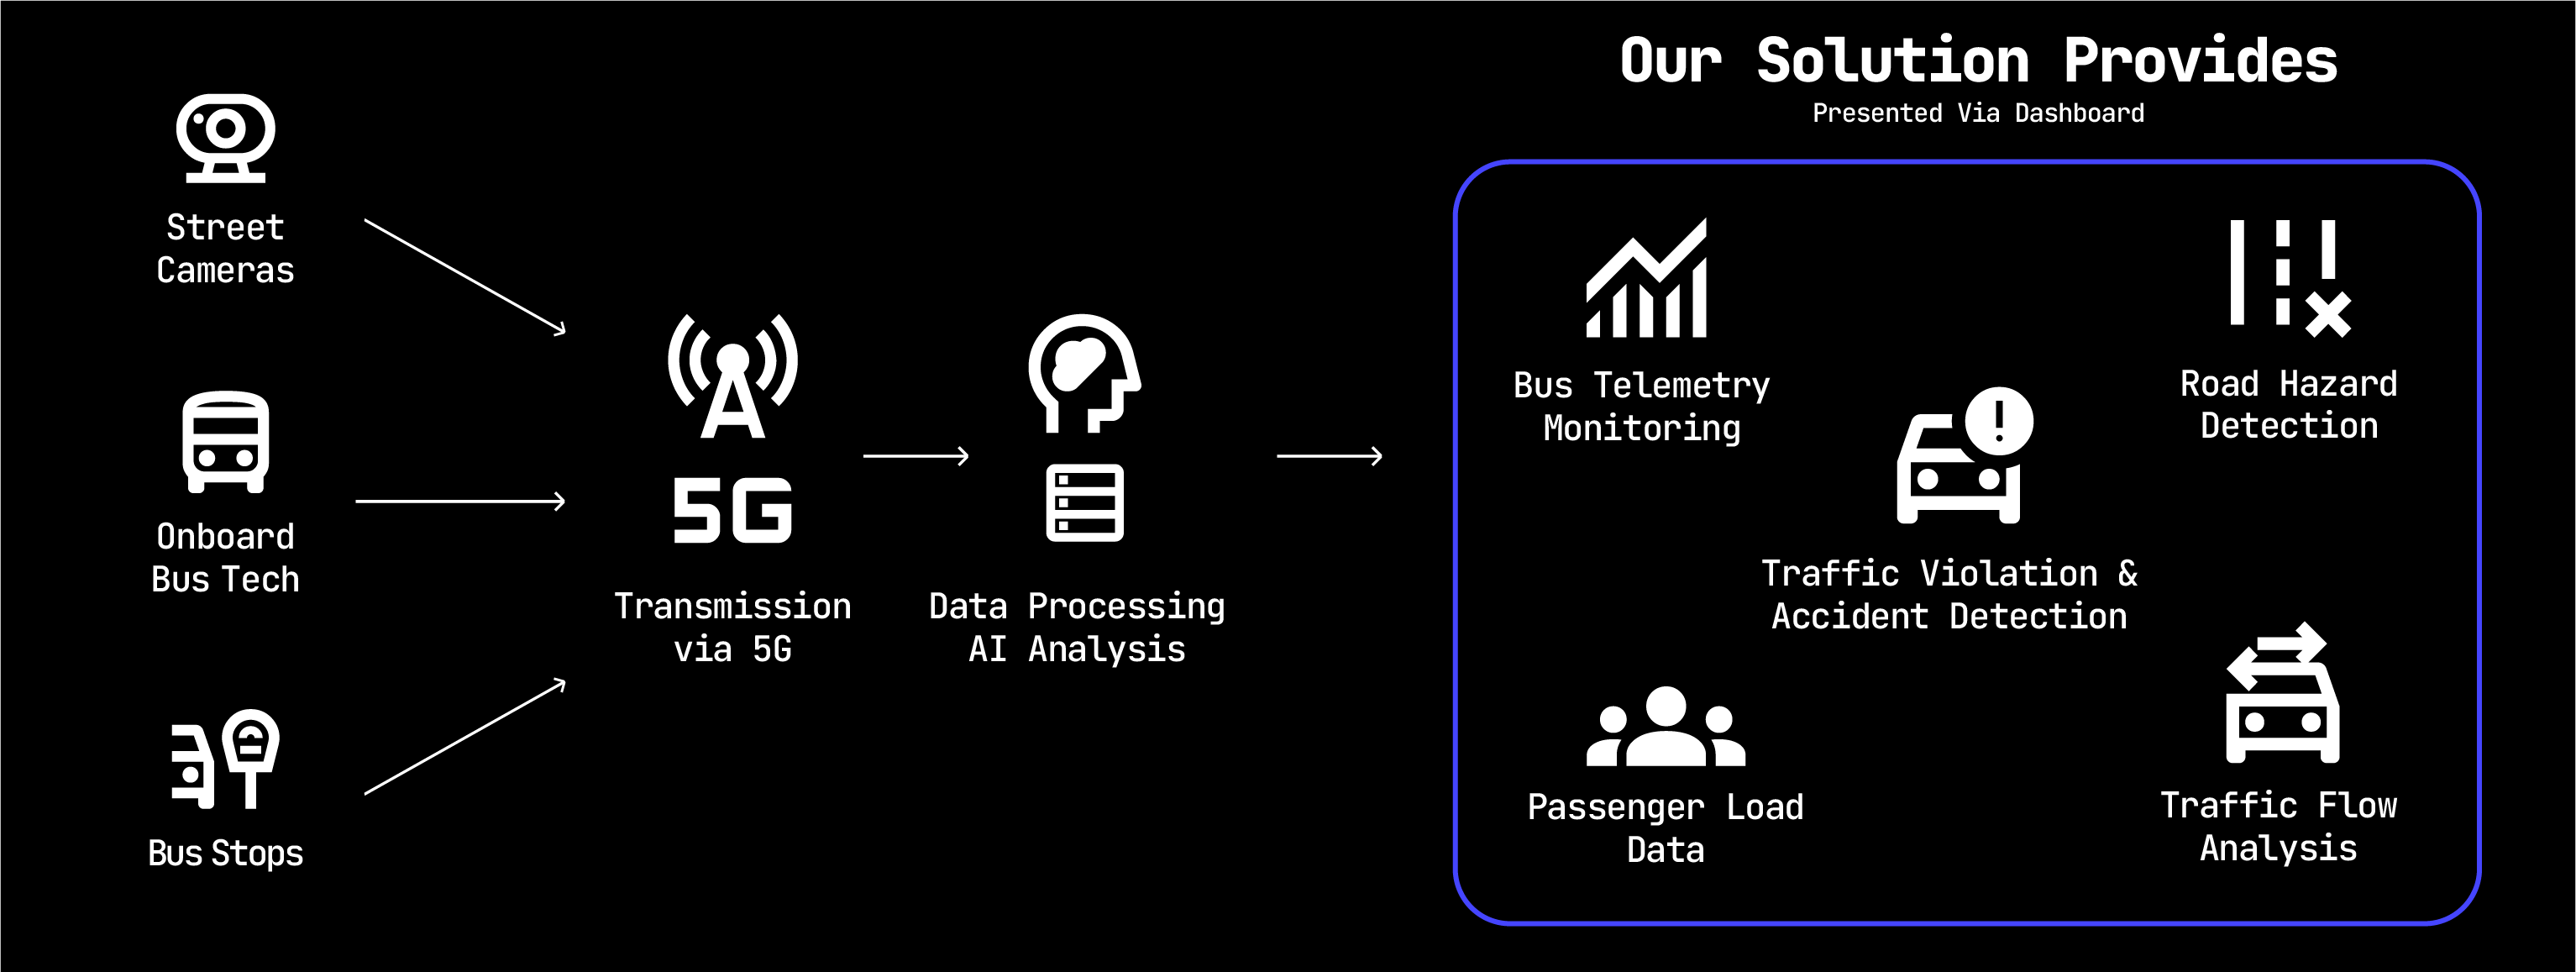
The system addresses all four challenges through three connected deployment points, tied together by a shared backend and dashboard.
Onboard Bus Technologies
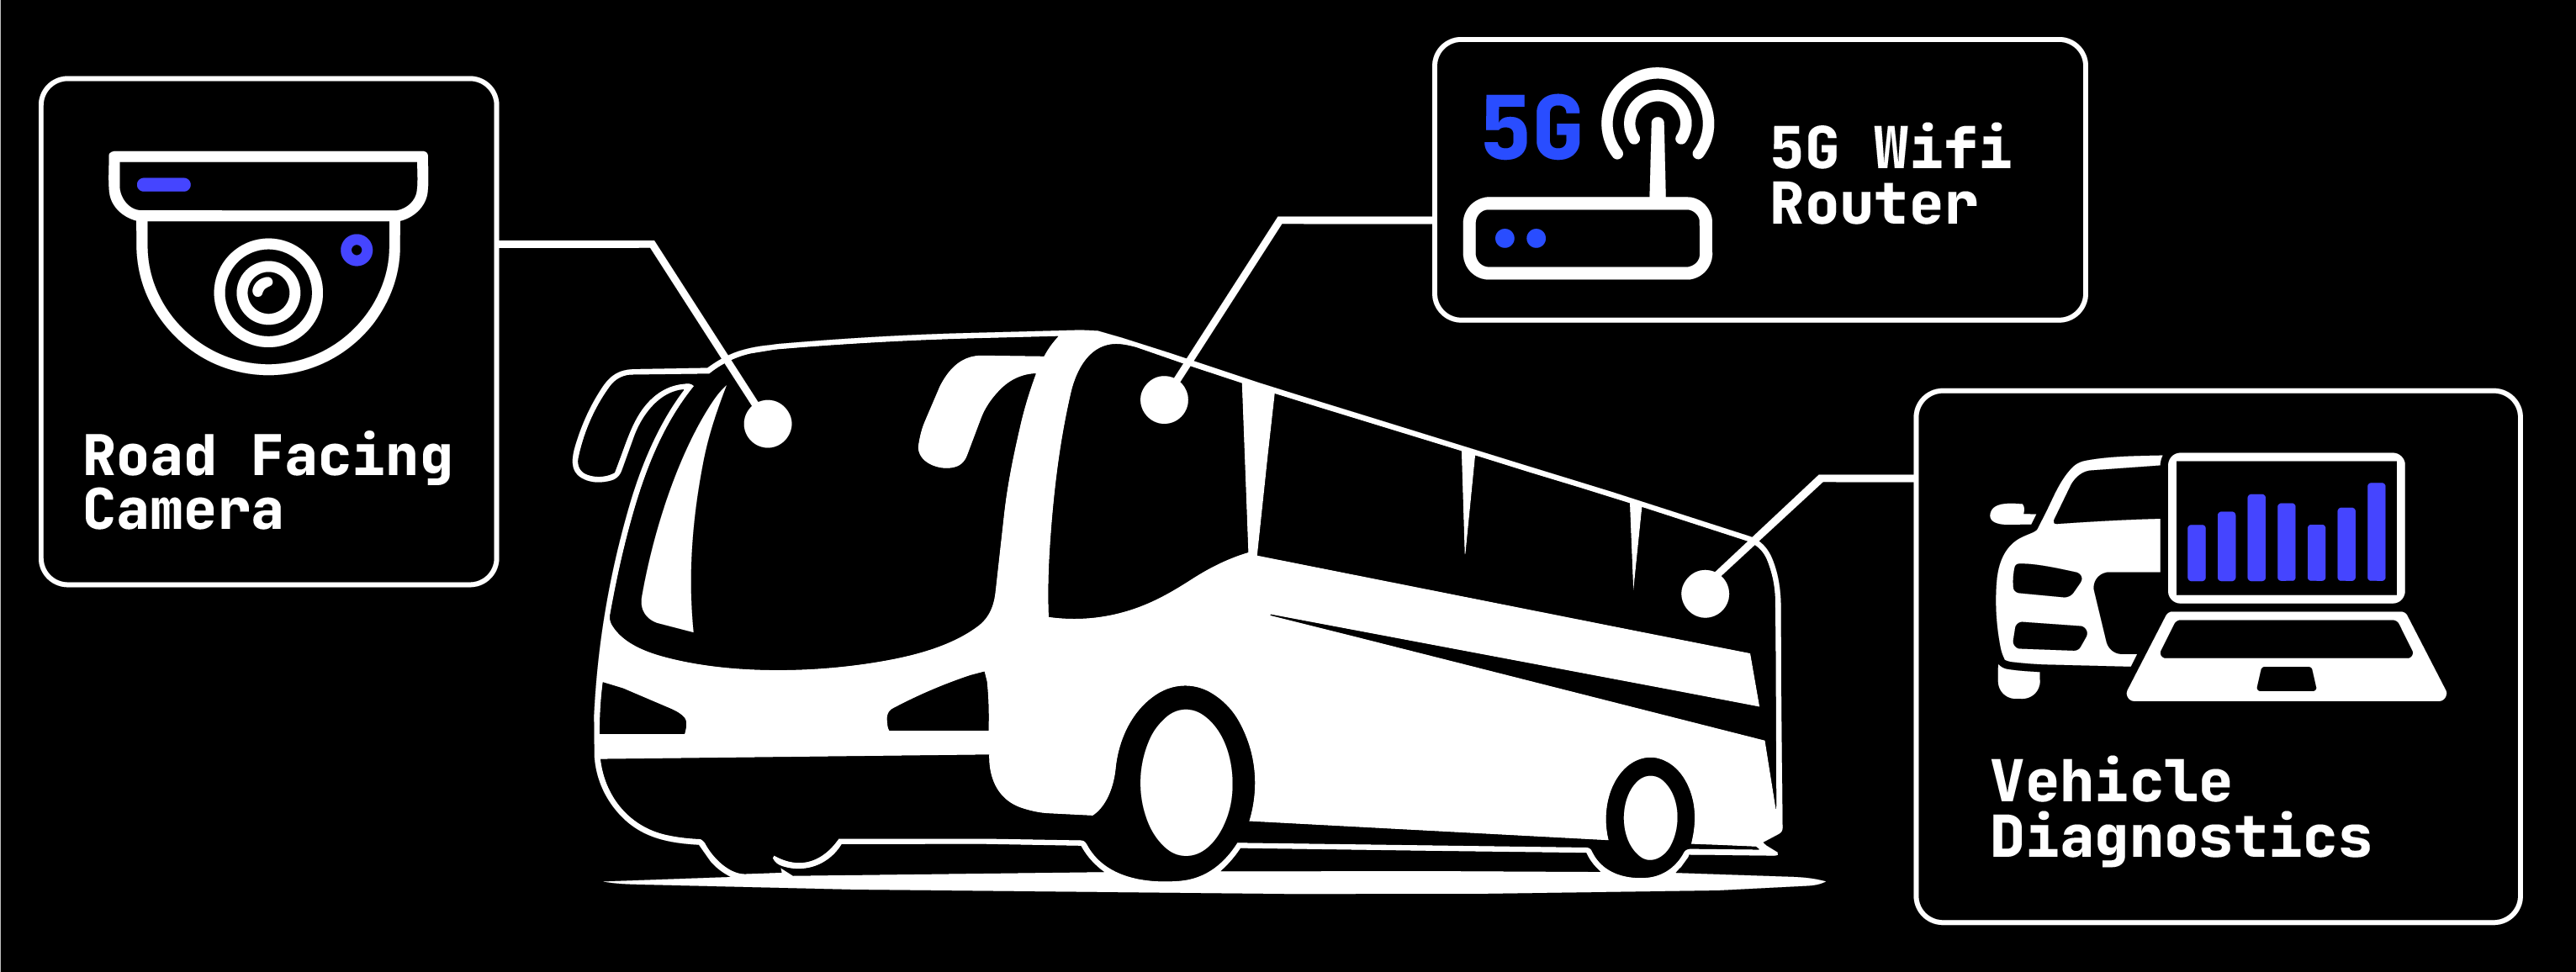
Each equipped bus carries a single enclosure combining an onboard computer, a forward-facing camera, GPS, and a connection into the vehicle's own diagnostics, alongside a 5G router.
As the bus runs its route, this unit monitors road conditions, measures congestion along the way, tracks passenger load onboard, and watches for early signs of mechanical wear, all processed on the vehicle itself, in real time. To track passenger load, the router periodically scans for nearby devices' Wi-Fi signals, using their number, signal strength, and change over time to estimate how many people are on board.
Most video analysis happens on the bus itself, so only processed results, not a continuous video feed, need to travel onward; these analytics and telemetry readings are then sent to the central system over the 5G connection.
Street Camera Utilization
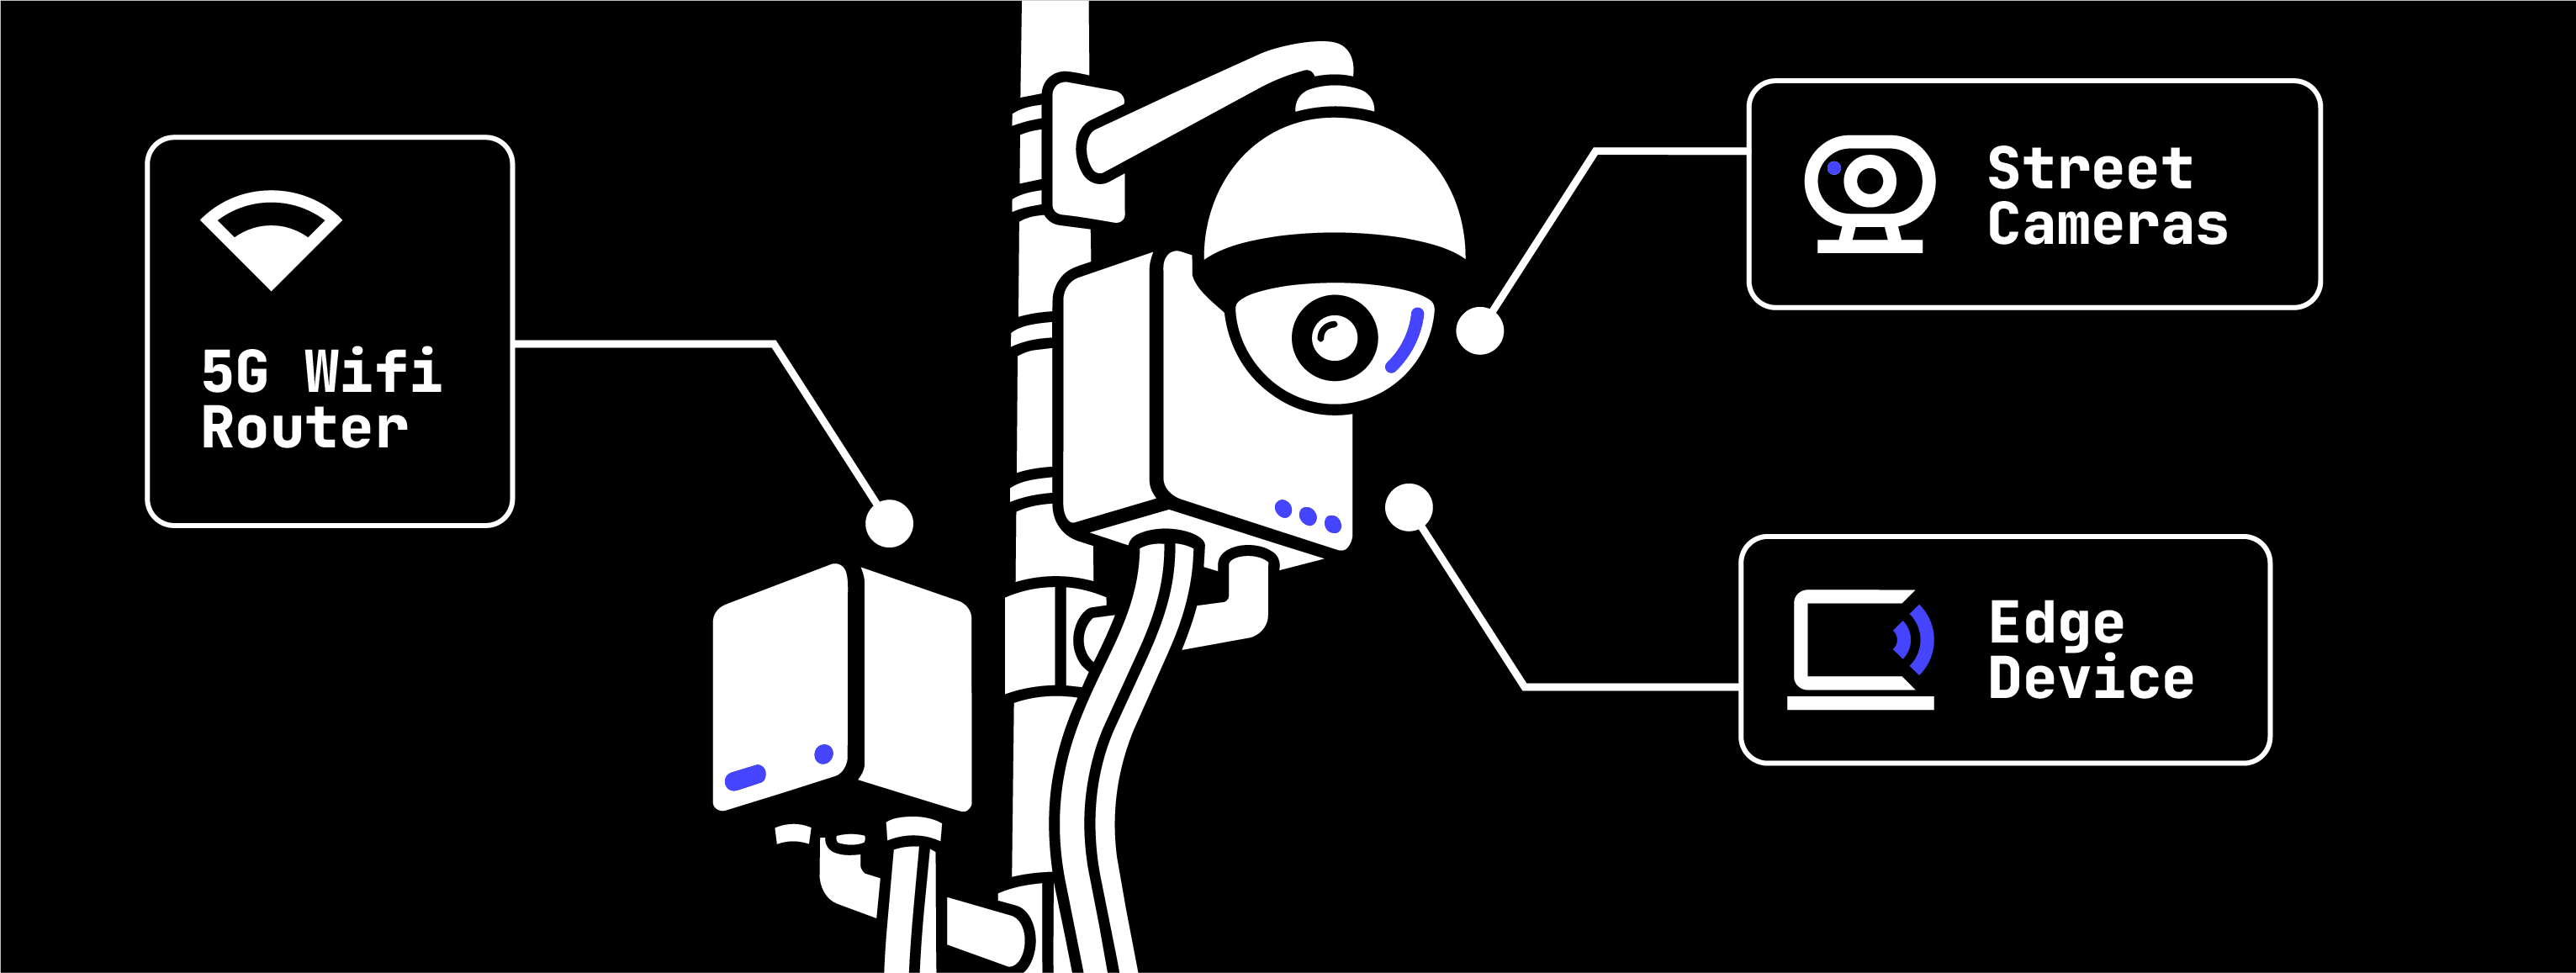
At five signaled intersections at Vilnius, a stationary camera, onboard computer, and 5G router are mounted on existing poles and powered through the city's street lighting network, avoiding the need for new electrical infrastructure.
The system monitors vehicles as they move through the intersection, analyzing their trajectories and vehicle types. These units detect traffic violations, flag incidents as they happen, and continuously track traffic flow through the junction.
Bus Stop Deployments
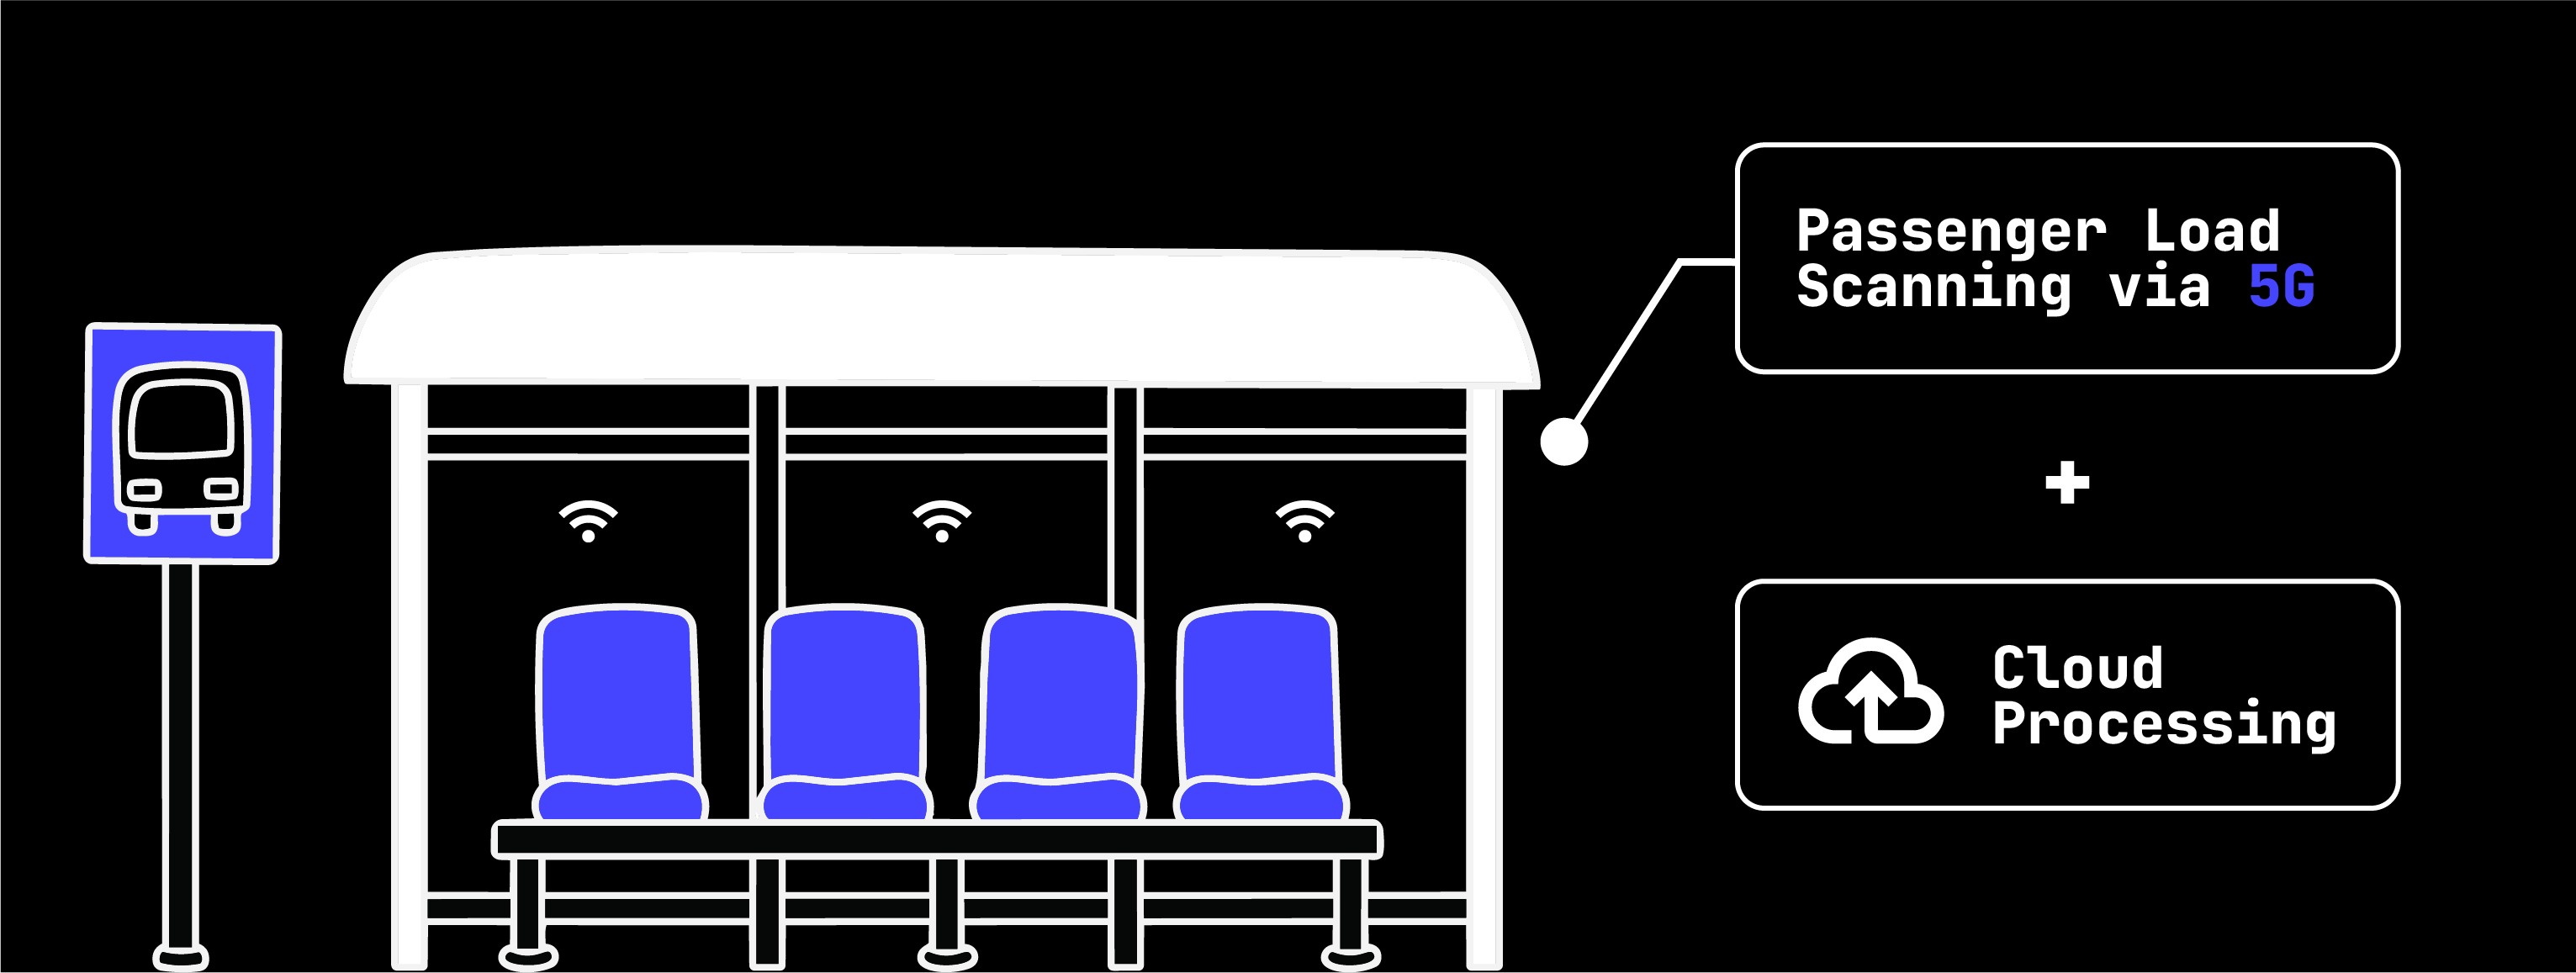
At five bus stops, a 5G router and external antenna quietly measure passenger presence, detecting nearby devices' Wi-Fi signals to gauge passenger flow and stop-level load. Rather than processing on-site, this data streams directly to the cloud, where AI models turn it into passenger flow measurements and forecasts.
Integrating it Together
Devices on buses and at intersections process most of their analysis locally, while bus stop sensors send raw readings to the cloud.
Data streams in continuously, refreshed every 10 to 60 seconds depending on the source, and AI models analyze it around the clock, surfacing results on live dashboards organized the way operators actually think about the network: by bus, by stop, and by street camera.
Our System in Action
Our solutions facilitates the following outcomes that creates a smarter transportation system that addresses the current challenges at hand.
Traffic Flow Monitoring
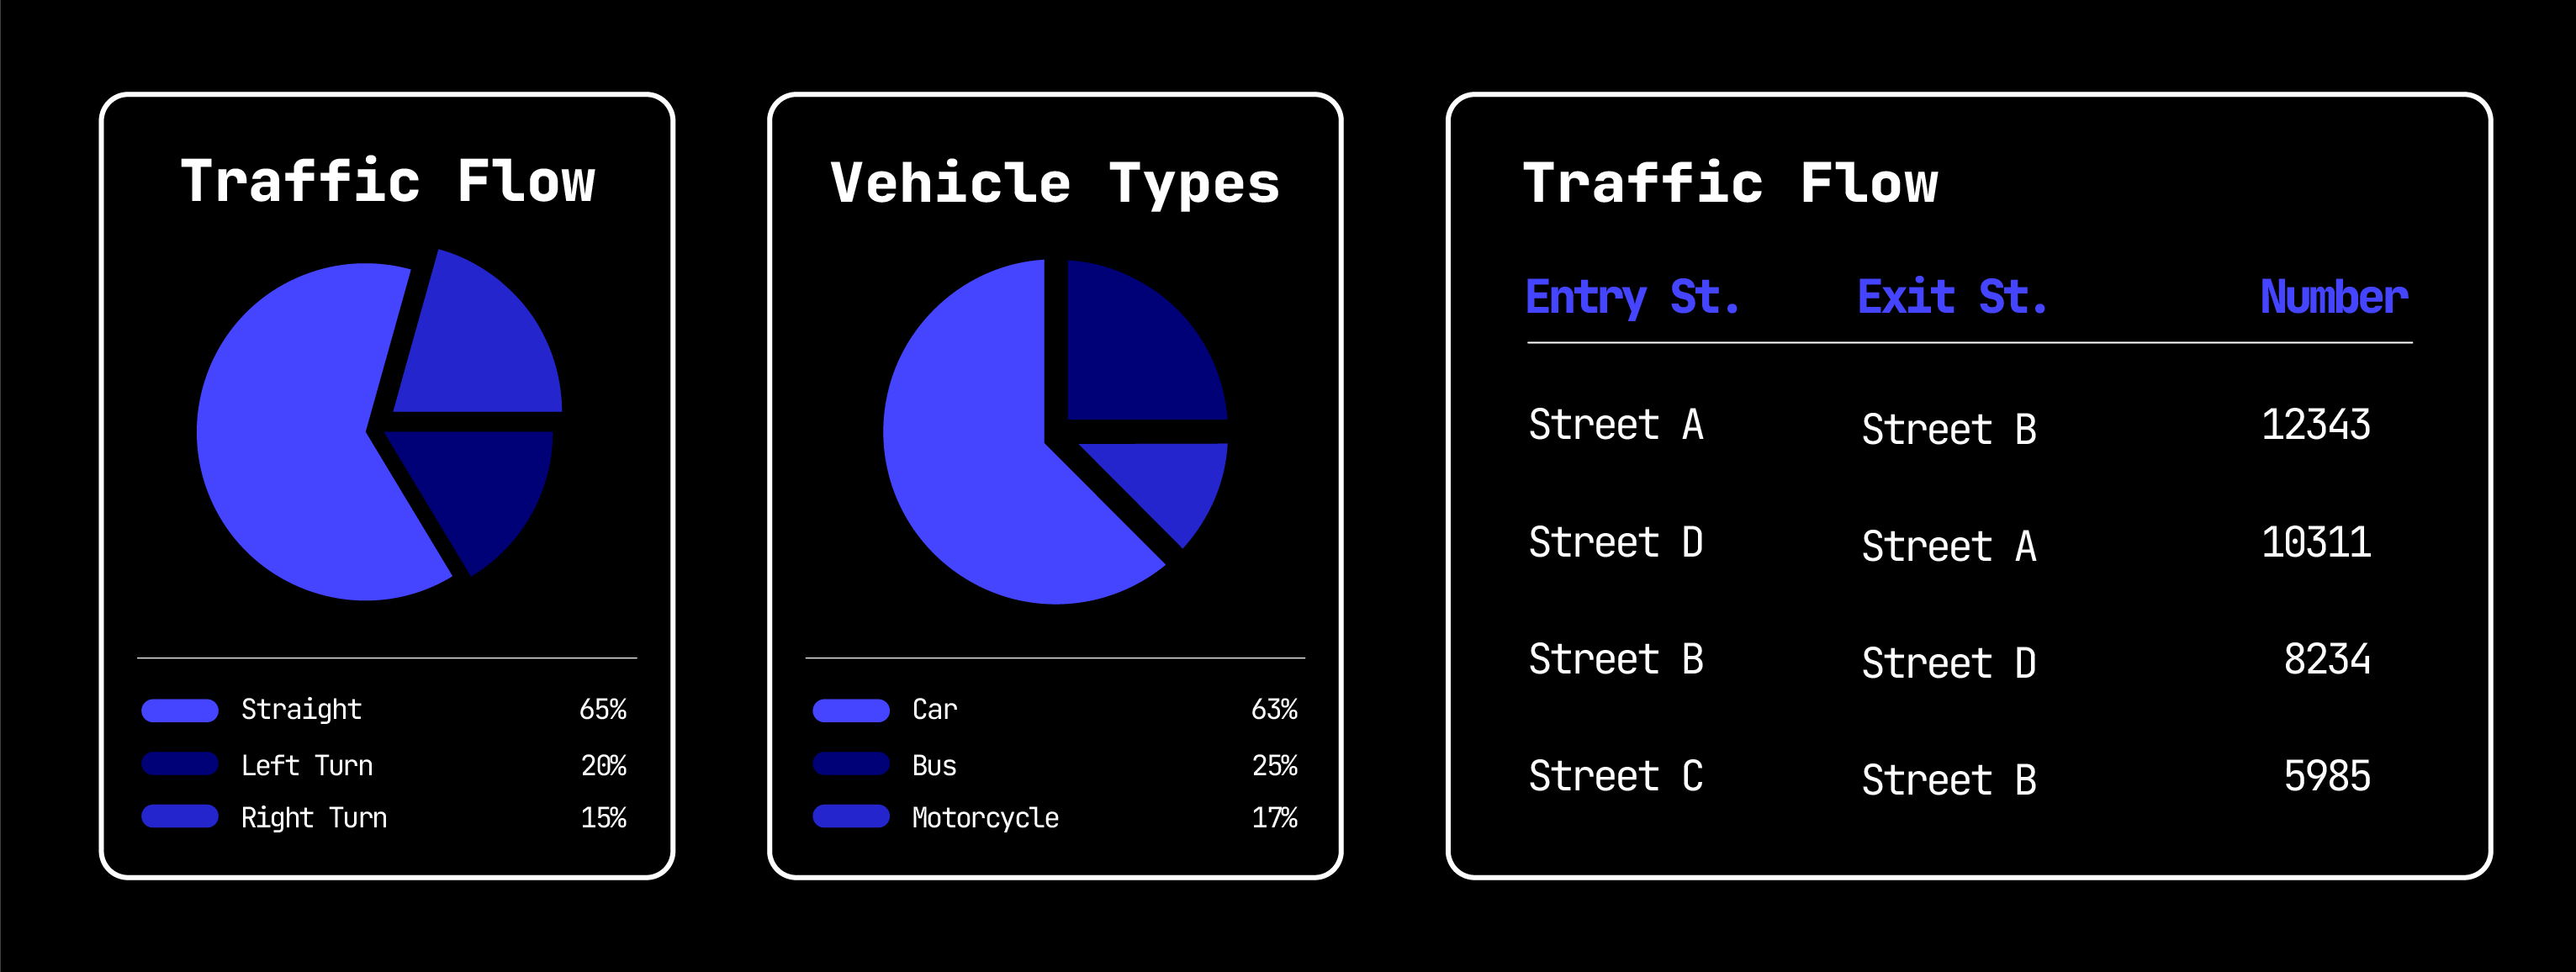
Cameras at each signaled intersection detect and track vehicles as they move through the junction, classifying them by type, car, truck, bus, motorcycle, bicycle, pedestrian, and following each one from entry to exit. That lets operators see not just how many vehicles pass through a given intersection, but where they're coming from, which turns they make, and how traffic is distributed across directions and vehicle types over the course of a day.
Detection runs at 97.9% precision and tracking holds 96.6% precision as vehicles move through the frame, reliable enough to build real traffic patterns from. These detections are shown in our dashboards break that this down to 10-minute intervals, by intersection, by direction, and by vehicle type, giving planners a concrete, evidence-based way to identify the lanes carrying the heaviest load.
Passenger Flow Analytics
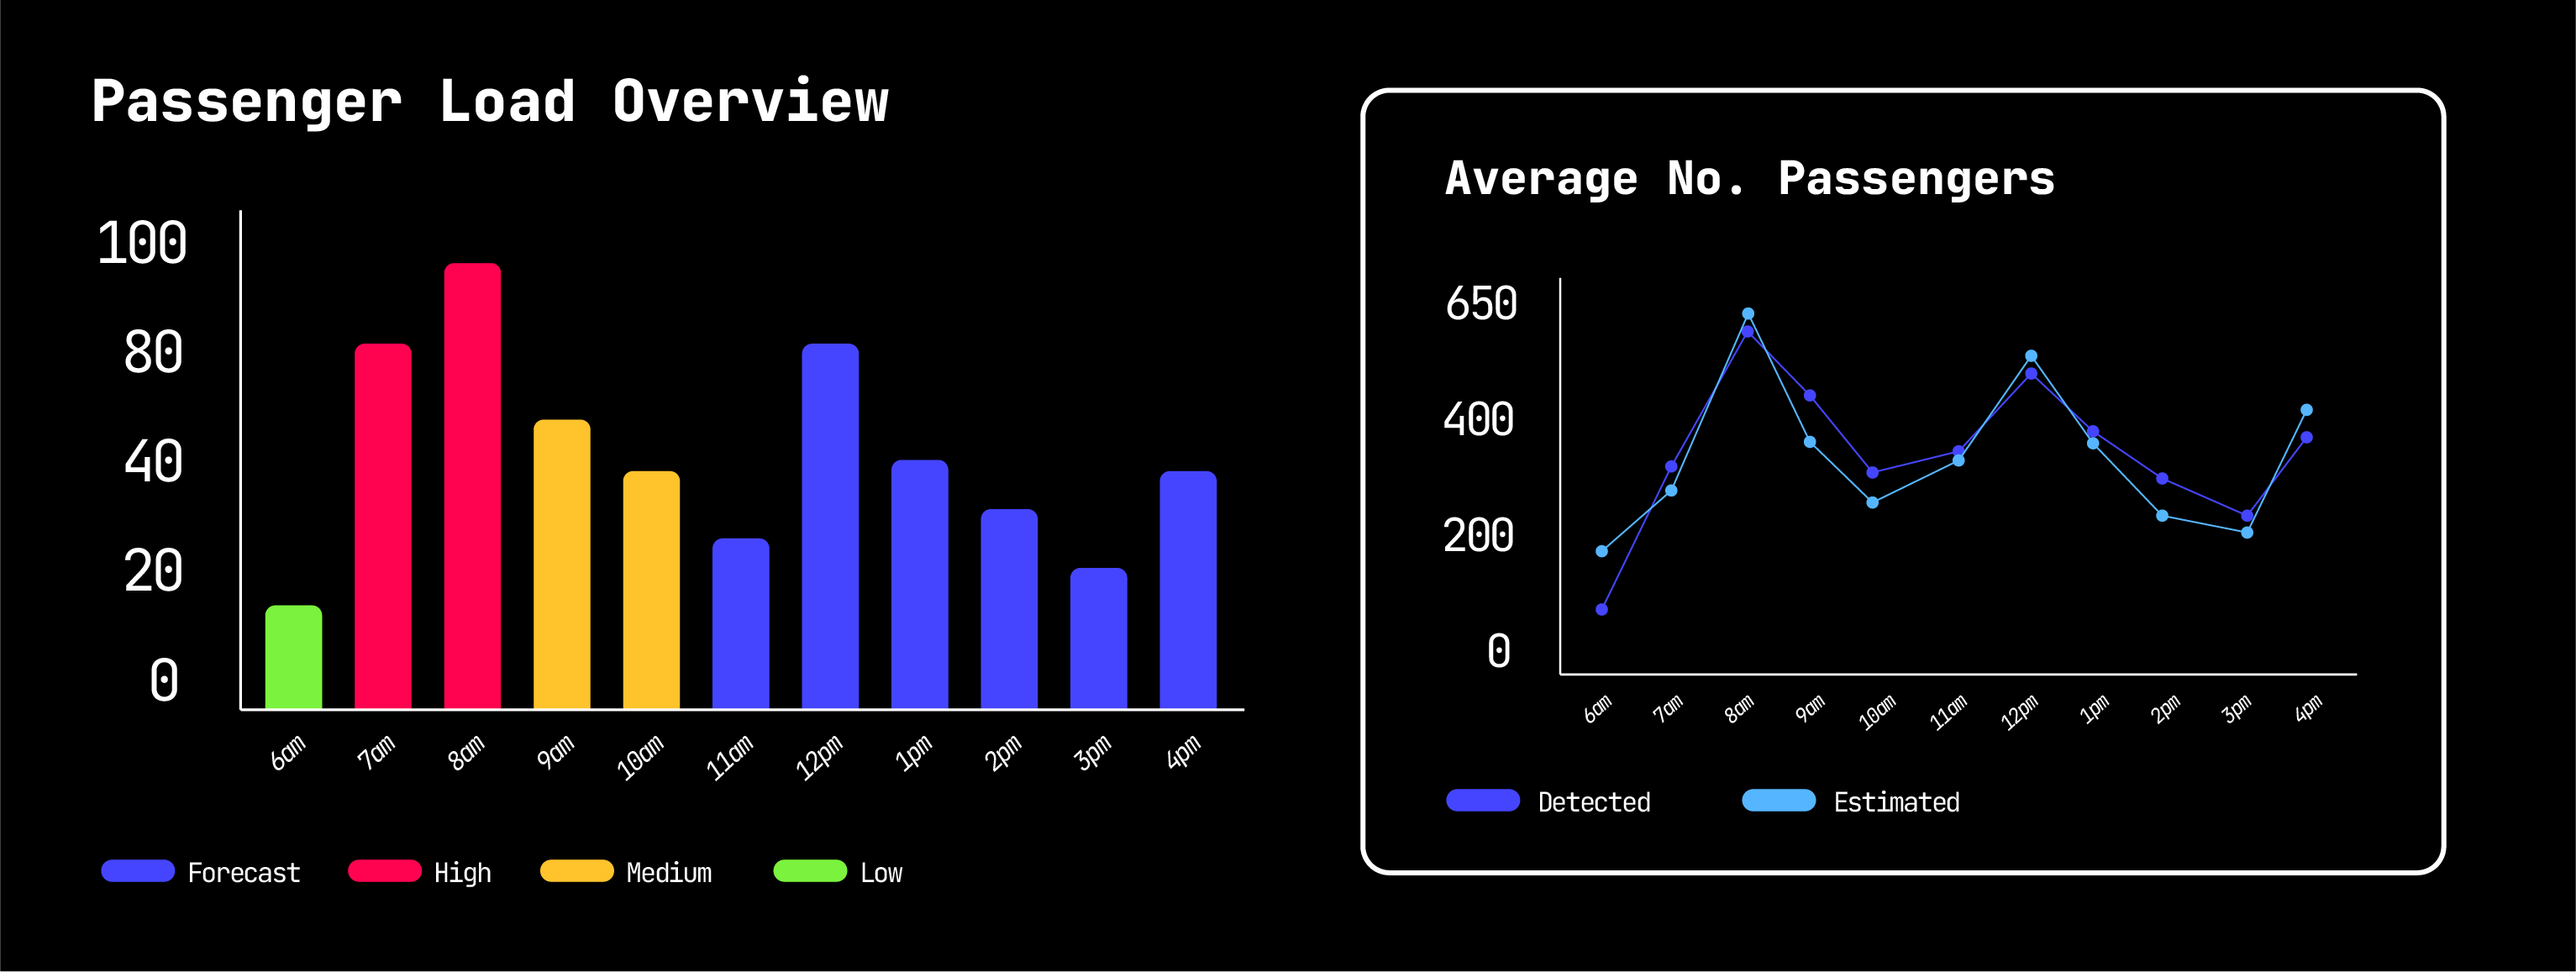
Wi-Fi routers at bus stops and on buses detect nearby devices via MAC addresses and use their appearance and disappearance over time to reconstruct passenger movement: how long people wait at a stop, when boarding and alighting happen, and which routes riders actually travel. This shows stop-level counts that track the network's known passenger geography closely, and a forecasting model that runs stably in production, forecasting 6 hours ahead. This turns anecdote into a real origin–destination picture of the network, and stop-level crowding data operators can act on hour by hour.
One key limitation of this approach is worth noting: it counts passengers on the assumption that each person carries a single detectable Wi-Fi device. If a passenger carries no detectable device, or carries more than one, the system may produce inaccurate counts. The current version doesn't separately flag these cases, so getting a precise absolute passenger count would mean pairing this technology with additional counting methods and complementary technologies whose integration int our system is currently under evaluation.
We view this as enough validation for our approach at a pilot scale run across 5 buses and 5 stops. However, a wider deployment across more stops and routes would be needed to build a comprehensive view of passenger flow across the whole network of the municipality.
Traffic Violation & Accident Detection
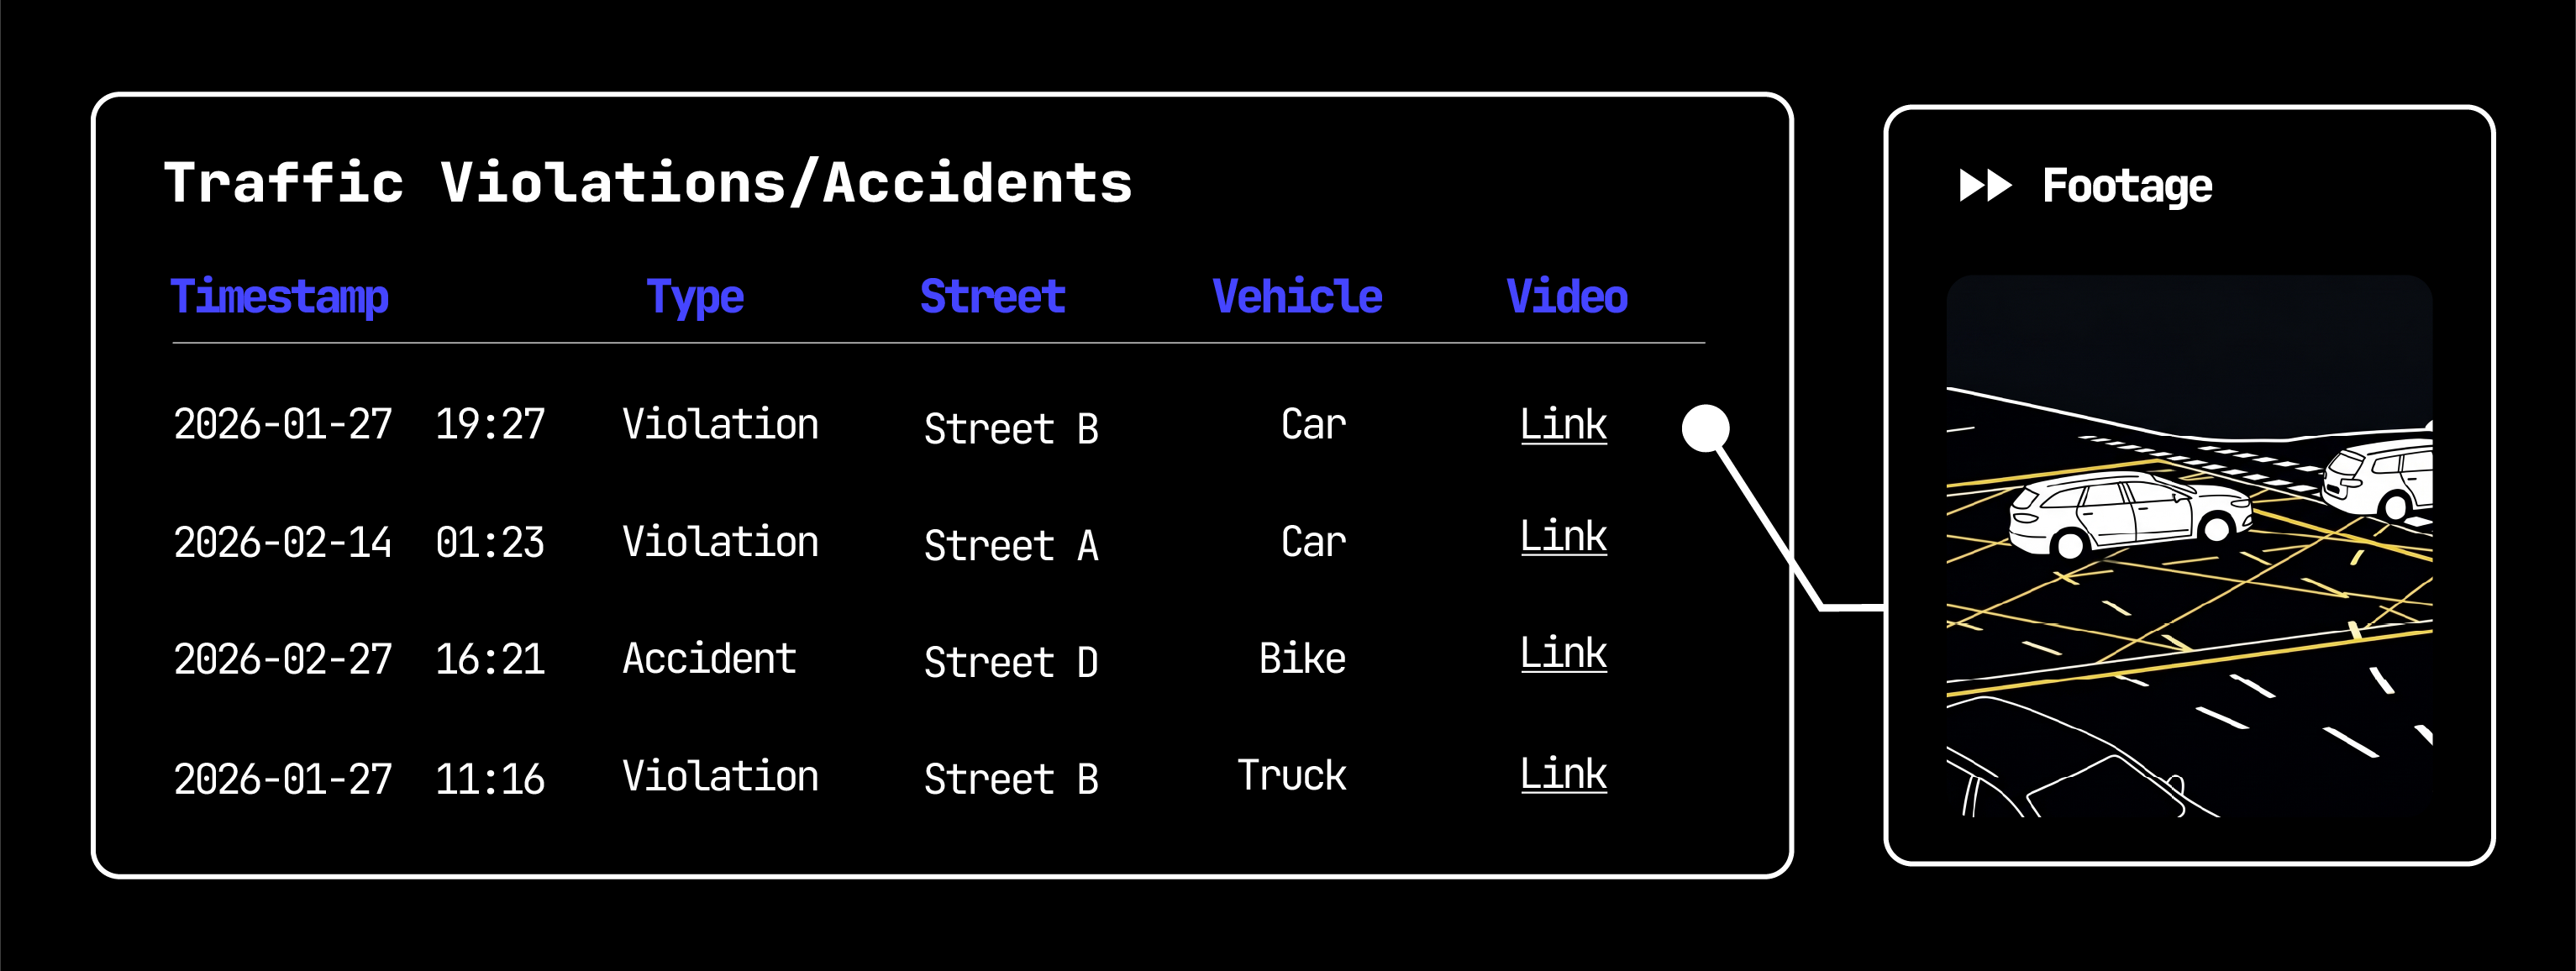
The same vehicle tracking feeds a violation check: any vehicle that stops inside an intersection's marked no-stop zone for more than a couple of seconds is automatically flagged, backed by a saved video clip to the dashboard so staff can verify it at a glance. Meanwhile, when a human is detected within the zone for significant time, the system flags this as an accident.
When something looks like an accident rather than a routine violation, the system sends an initial alert within 5 to 10 seconds and a fuller AI-generated read on the situation within 30 to 40 seconds: fast enough to matter, and a clear upgrade over waiting for someone to notice and call it in.
Our deployed pilot achieved 90% reliability in correctly identifying the specified traffic violation. The remaining margin comes down to judgment calls the system hasn't fully learned yet: distinguishing a genuine violation from a vehicle that only briefly paused mid-intersection to turn. As turn-direction data improves with wider camera coverage, this distinction gets easier to make automatically.
Road Condition Monitoring
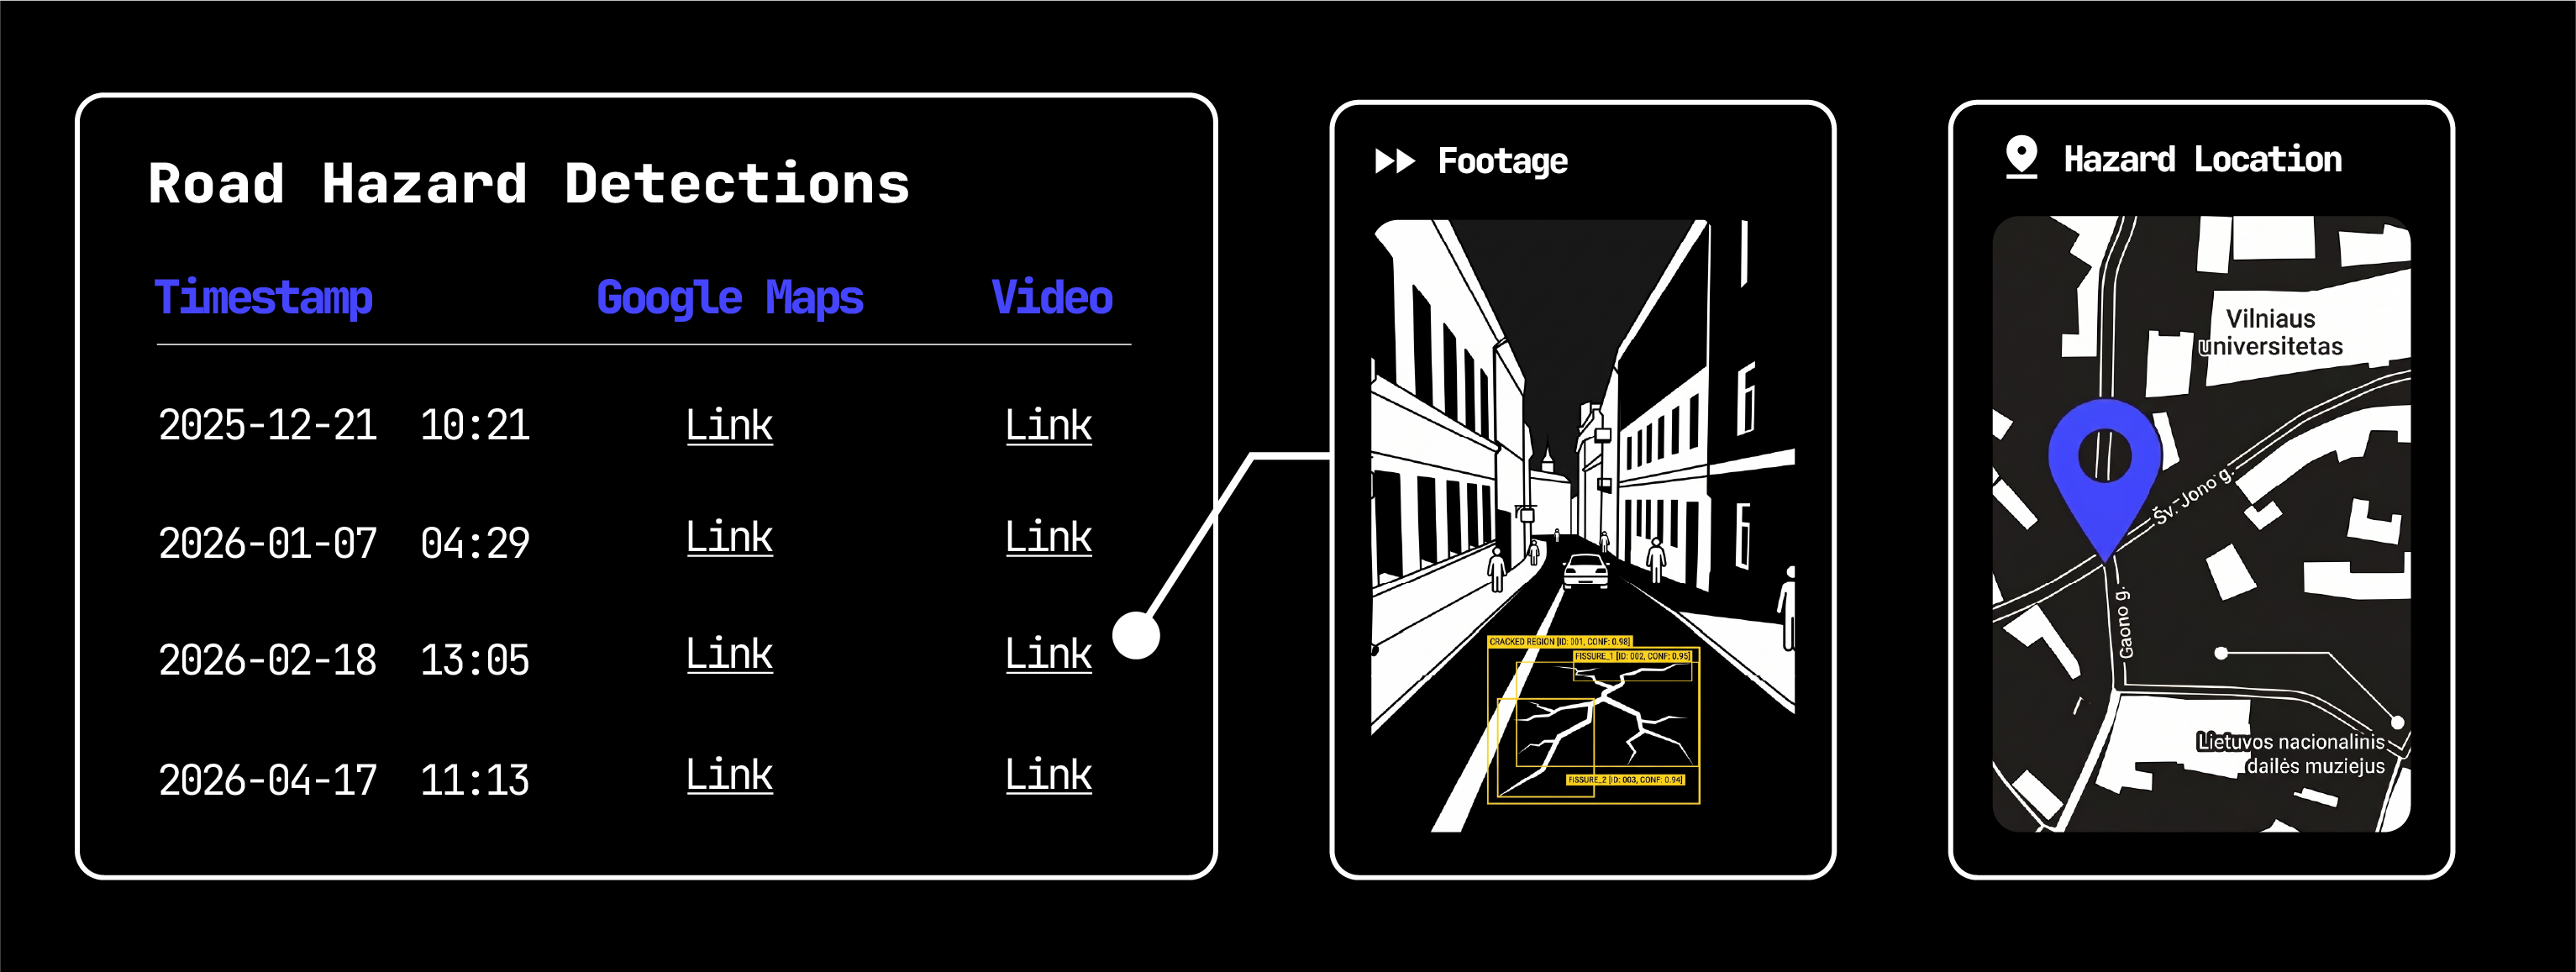
Instead of waiting for a citizen to report a pothole or damaged manhole cover, cameras already mounted on buses continuously scan the road surface as they drive their routes, flagging hazards automatically and pairing each one with video from the moment it was detected.
The system is strongest on large, well-defined hazards, manhole covers, in particular, are detected with 92% precision, the clearest result across all defect types tested, while smaller or more subtle surface wear, like faint cracking or patchy sections, is still harder for the model to catch consistently.
In practice, this means the system is already a reliable way to catch the hazards that matter most for safety and repair prioritization, with detection of finer-grained wear as an area still being refined. From our pilot deployment, our system has been able to consistently identified recurring road hazards observed in the roads of the municipality.
Bus Telemetry and Maintenance Monitoring
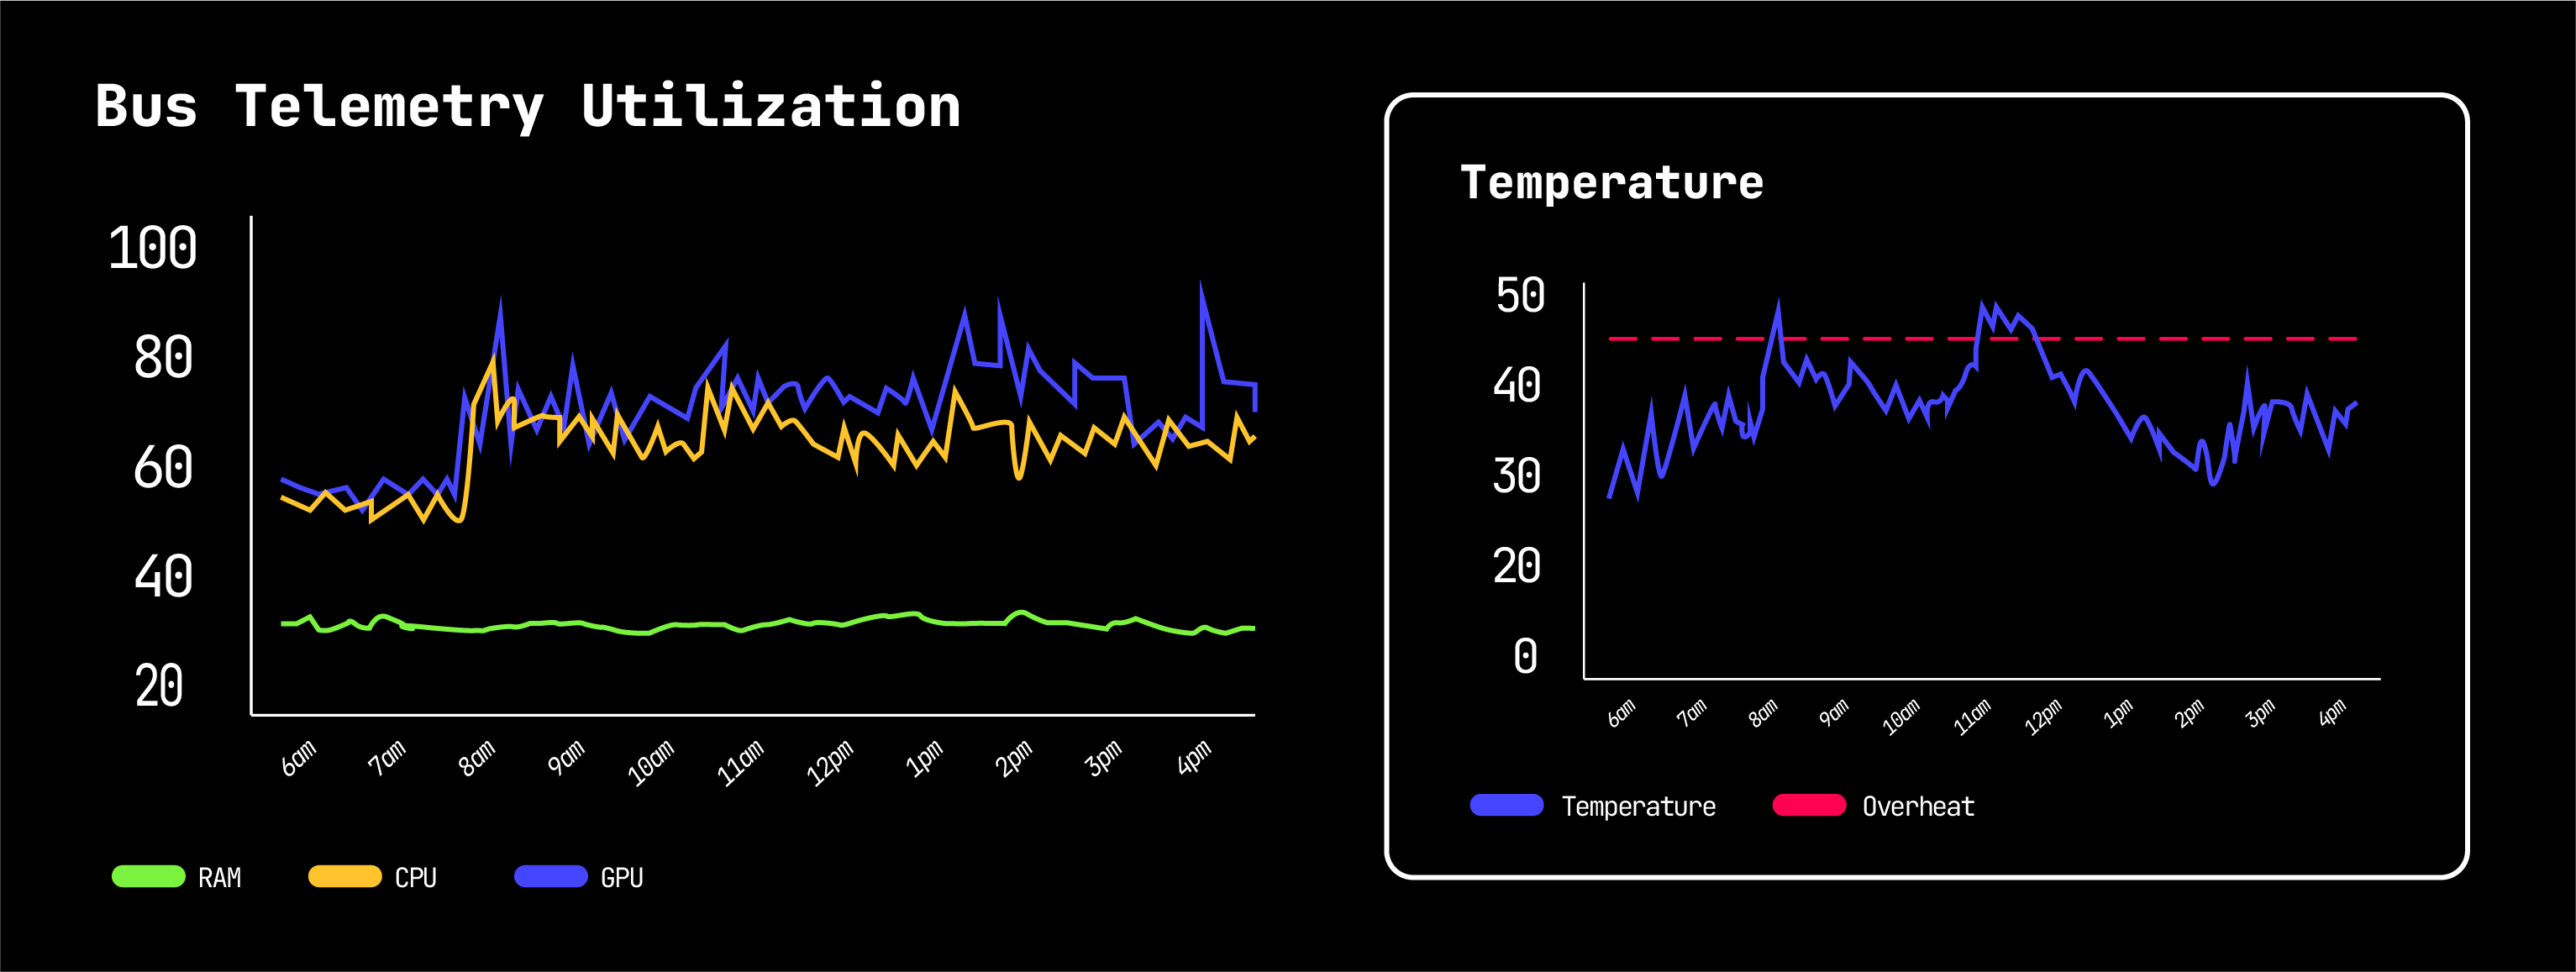
Each bus streams live diagnostic data like engine load, RPM, coolant temperature, fuel pressure, and more over 5G every 10 seconds, feeding a dashboard that compares each reading against normal operating ranges and includes an AI-generated health assessment along with a plain-language summary of what's trending abnormal and why.
The full pipeline, from onboard data capture through cloud-based classification, was built and validated during the project; live analytics in full production use is the next step to roll out, turning maintenance from something staff respond to after a breakdown into something they can plan for ahead of time.
Future Applications
The system is modular, so new violation types and monitoring capabilities can be added as a city's needs evolve, without rebuilding anything from scratch. And because the underlying formula of using edge AI, 5G connectivity, and real-time dashboards isn't specific to Vilnius, it's directly transferable to any municipality facing similar congestion, safety, or maintenance-visibility challenges.
The same approach also reaches beyond public transport. Logistics companies could use the same real-time visibility to optimize fleet routing, manufacturers could apply the predictive maintenance model to industrial equipment, and utilities, healthcare providers, and retailers could each adapt the same real-time data and 5G foundation to their own operations.